LONDON CHAMBER OF COMMERCE & INDUSTRY
Brief:
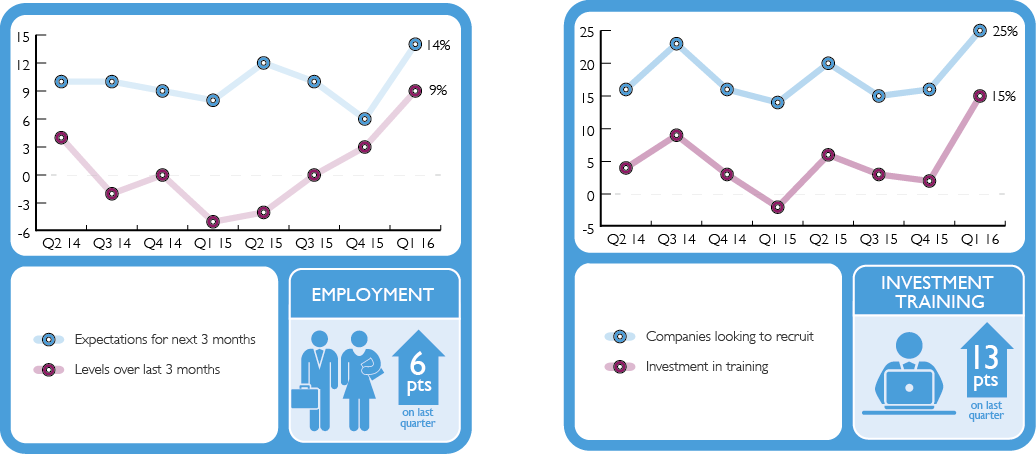
Redesign the identity of London’s longest running business survey report and introduce visual representations of research data through graphs and infographics.
Solution:
By designing a clear and colour coded graphic to demonstrate the quarterly aspect of the report, this is made into a feature on the front cover.
Data gathered from previous years is put into a graph and the data from the current quarter is highlighted with a graphic beside it.